
Yerke Salmurza
BI & Data Analyst
📍 Almaty, Kazakhstan
Power BI
DAX
Power Query
SQL
ETL
Dataflow
I'm a BI & Data Analyst with 5 years of experience in fintech and telecom, specializing in end-to-end BI development: data modeling, Power BI dashboards for C-level reporting, and product metrics (MAU/DAU, cohort analysis, unit economics, P&L). I've worked across various domains in fintech and telecom — translating complex business questions into scalable reporting solutions and collaborating closely with product owners and data engineers. Constantly developing my technical stack — currently taking a Data Engineering course, with focus on Python, dbt, and Airflow. Open to BI, Data Analyst, and Product Analyst roles — preferably remote.
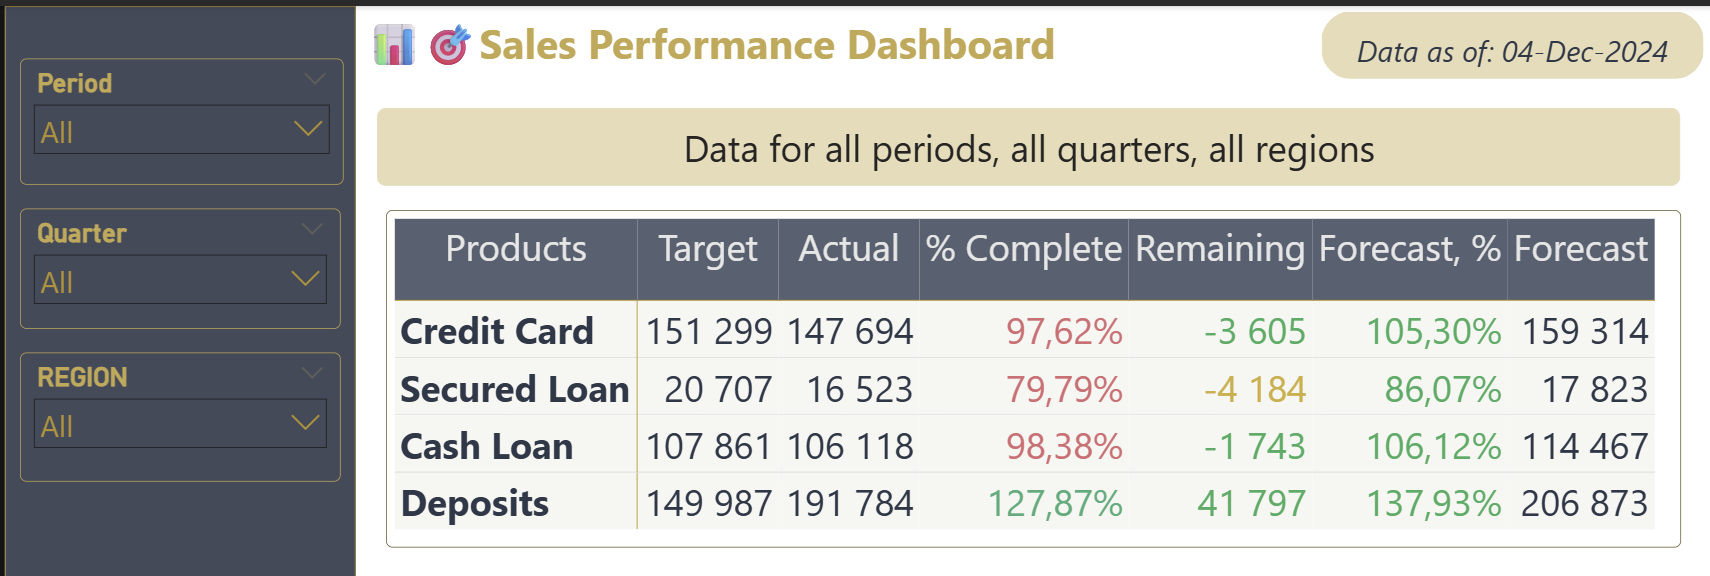
Track sales plan execution across regions and months, and forecast the final year-end performance based on actual results and working days passed.
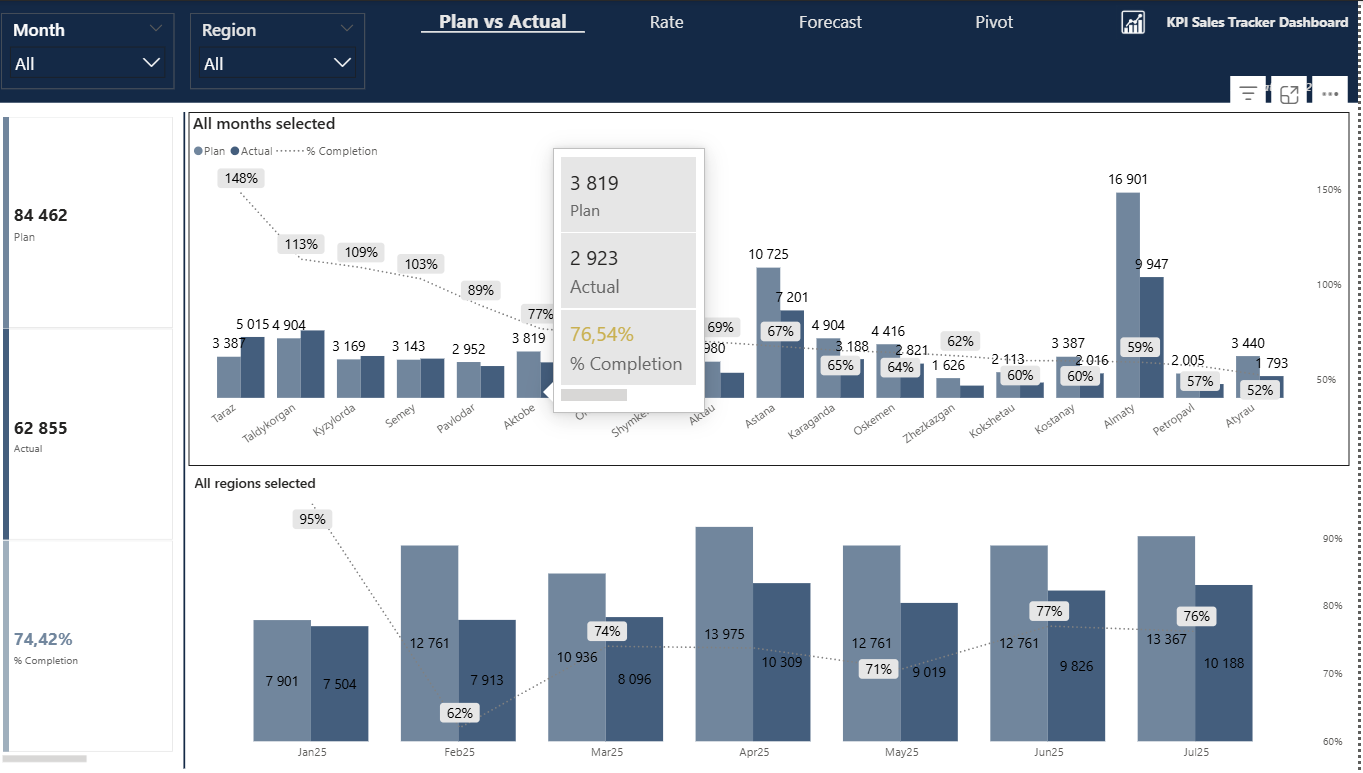
Plan vs Actual
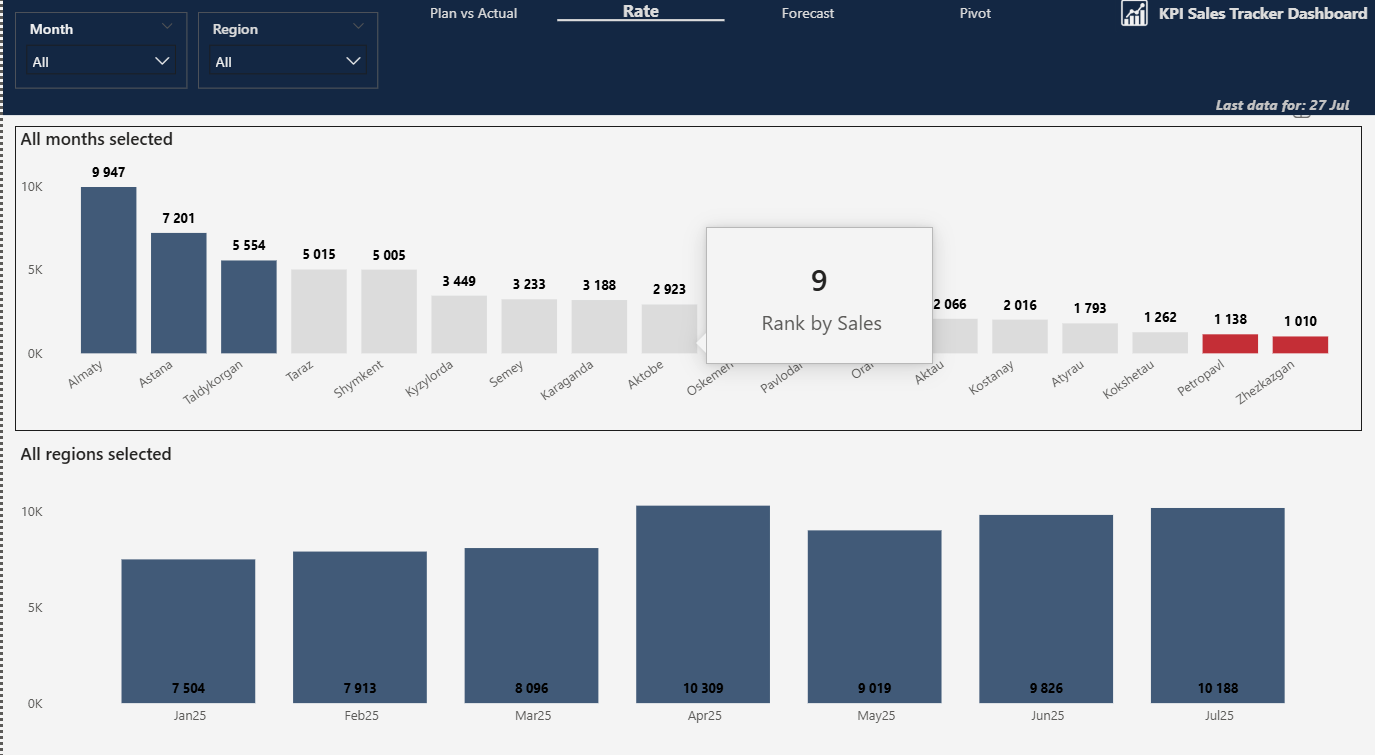
Rate
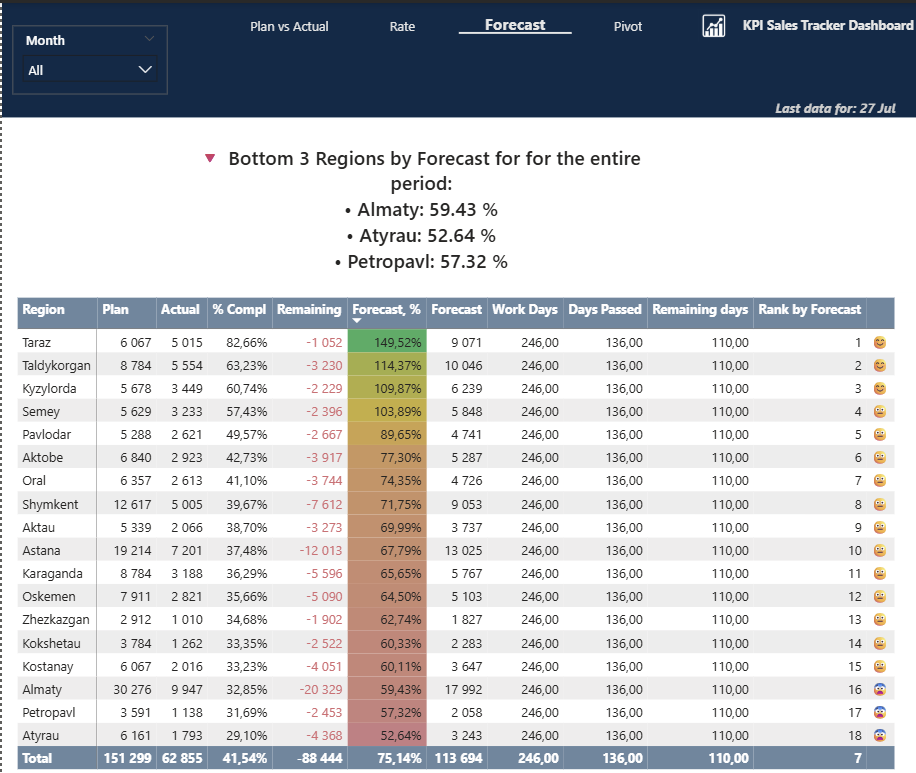
Forecast
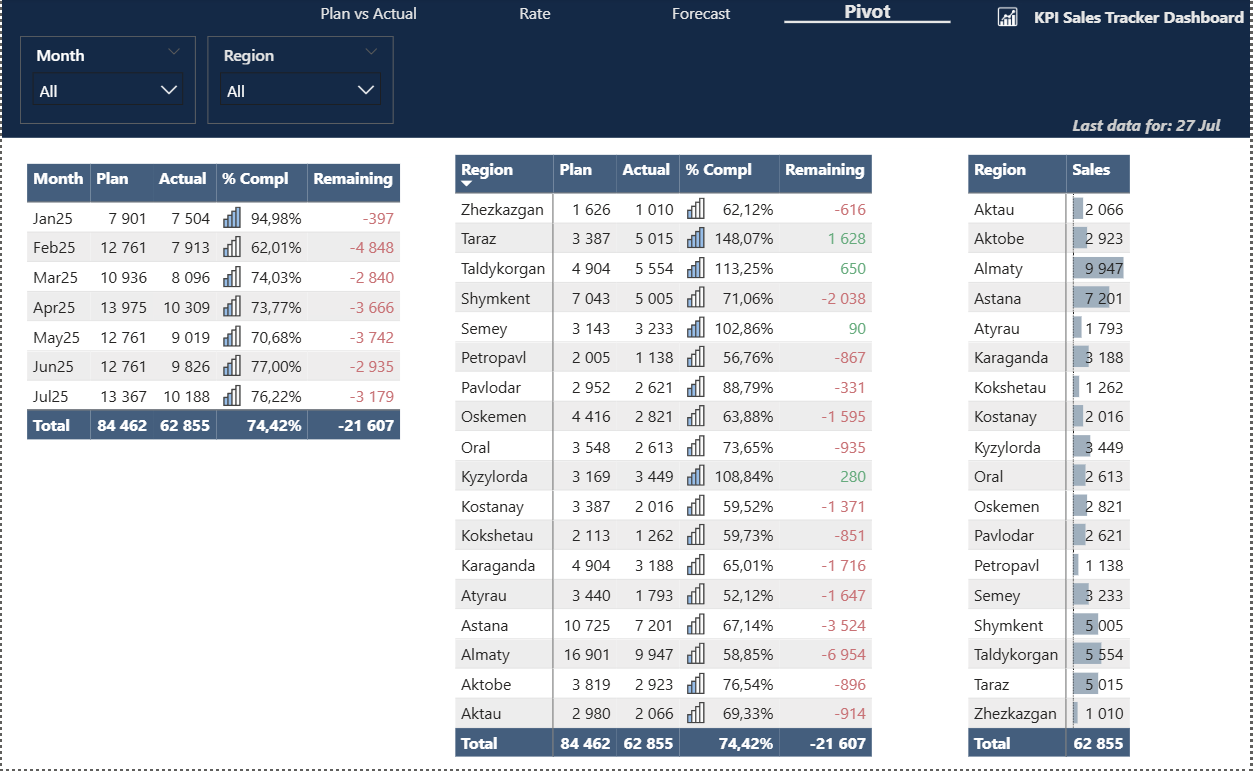
Pivot
Analytics dashboard for Atlas Medical Center (PROTEK Group). Covers employee health program usage, deposit placement efficiency, and complex program sales with conversion tracking. Built as a test assignment for Bilaabs.
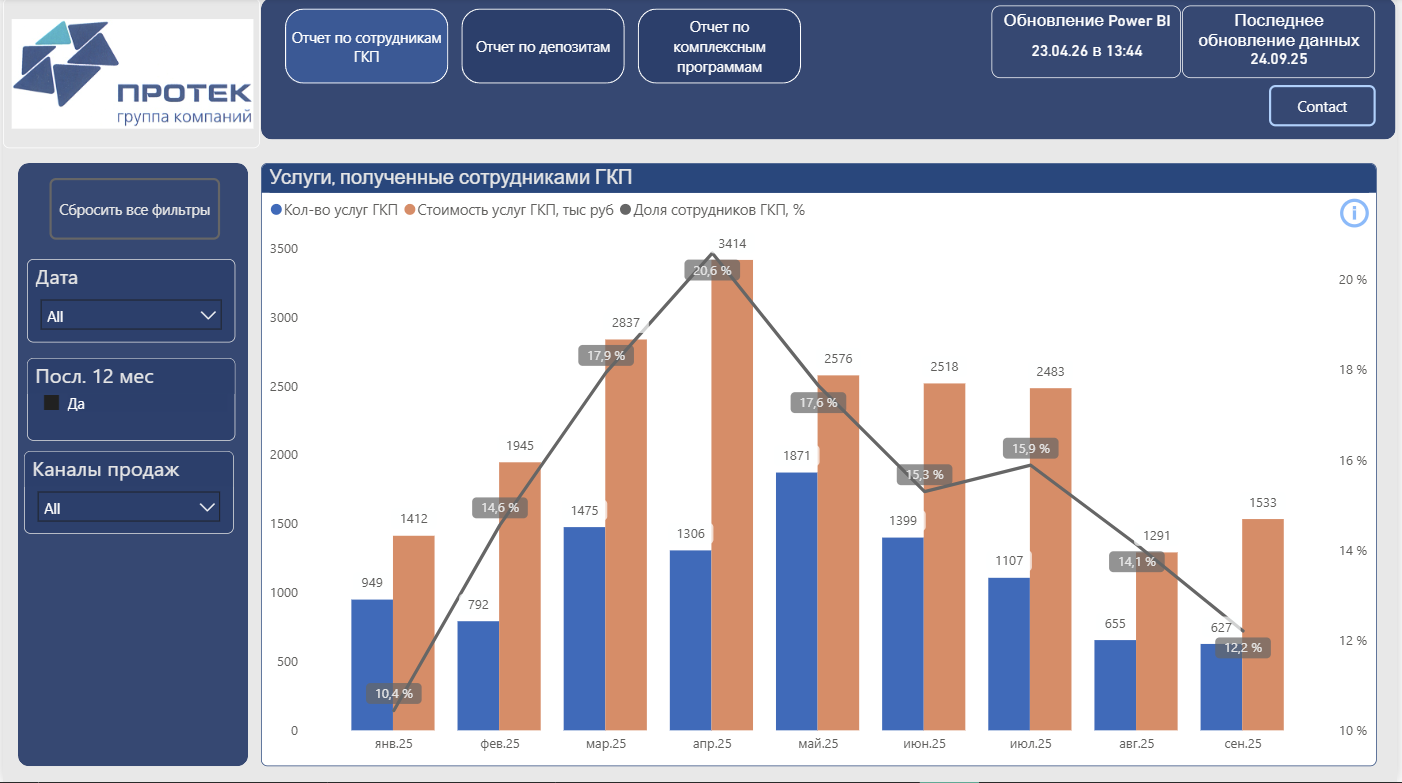
Page 1 — GKP Employee Services
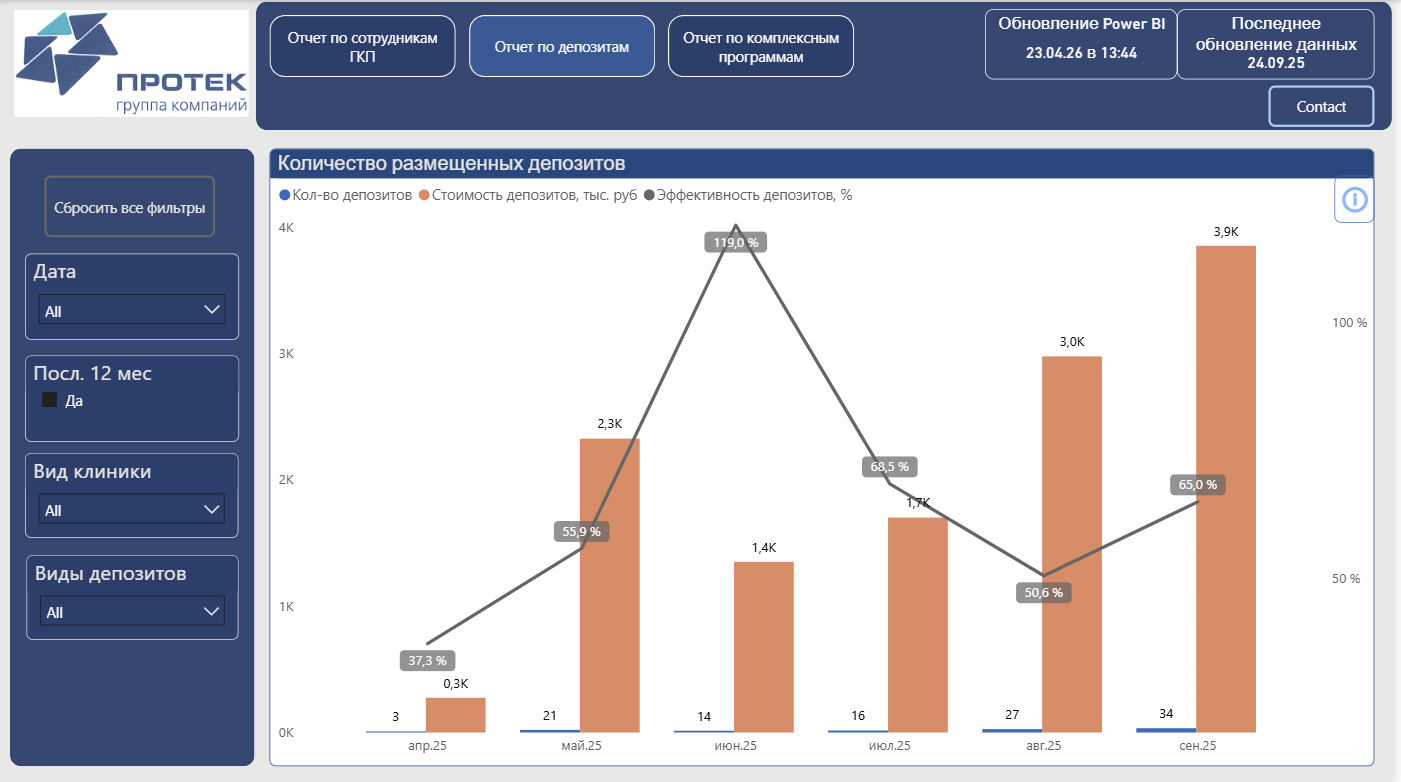
Page 2 — Deposits Report
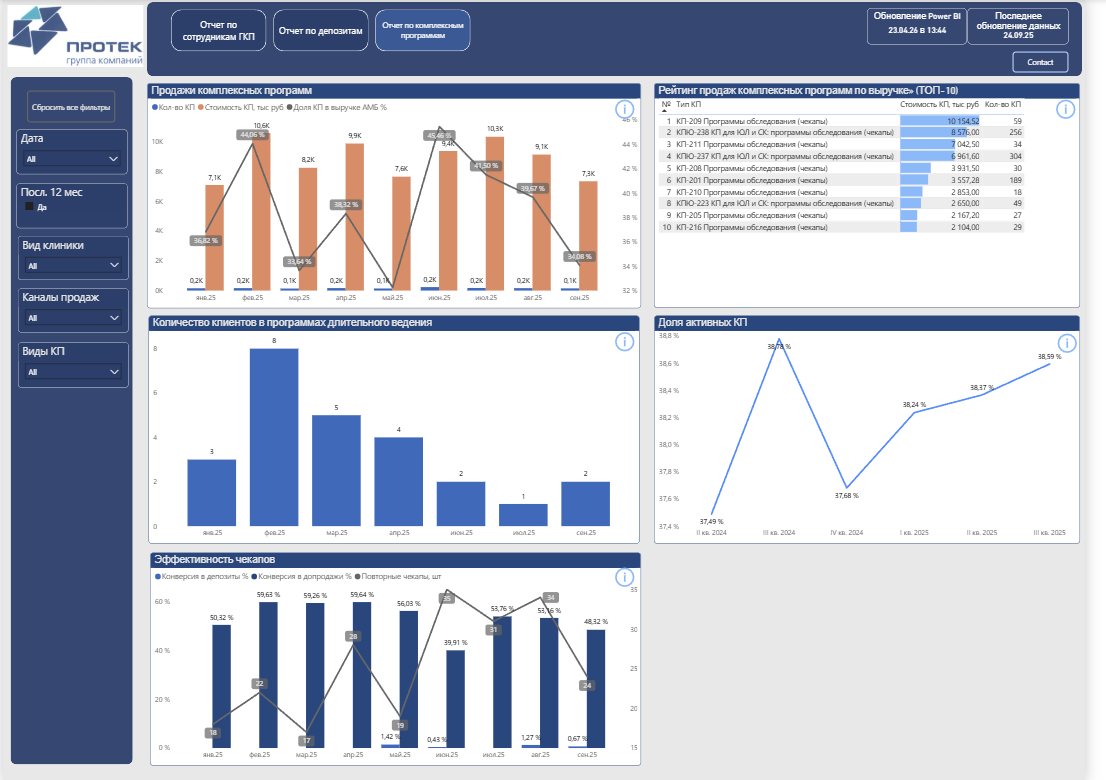
Page 3 — Complex Programs Report
Dashboard for tracking sales plan execution and forecasting year-end performance across 4 products (Credit Card, Secured Loan, Cash Loan, Deposits) by region and period. Features dynamic KPI cards with gauges, color-coded execution status, and working-day-based forecast logic.
Sales Targets
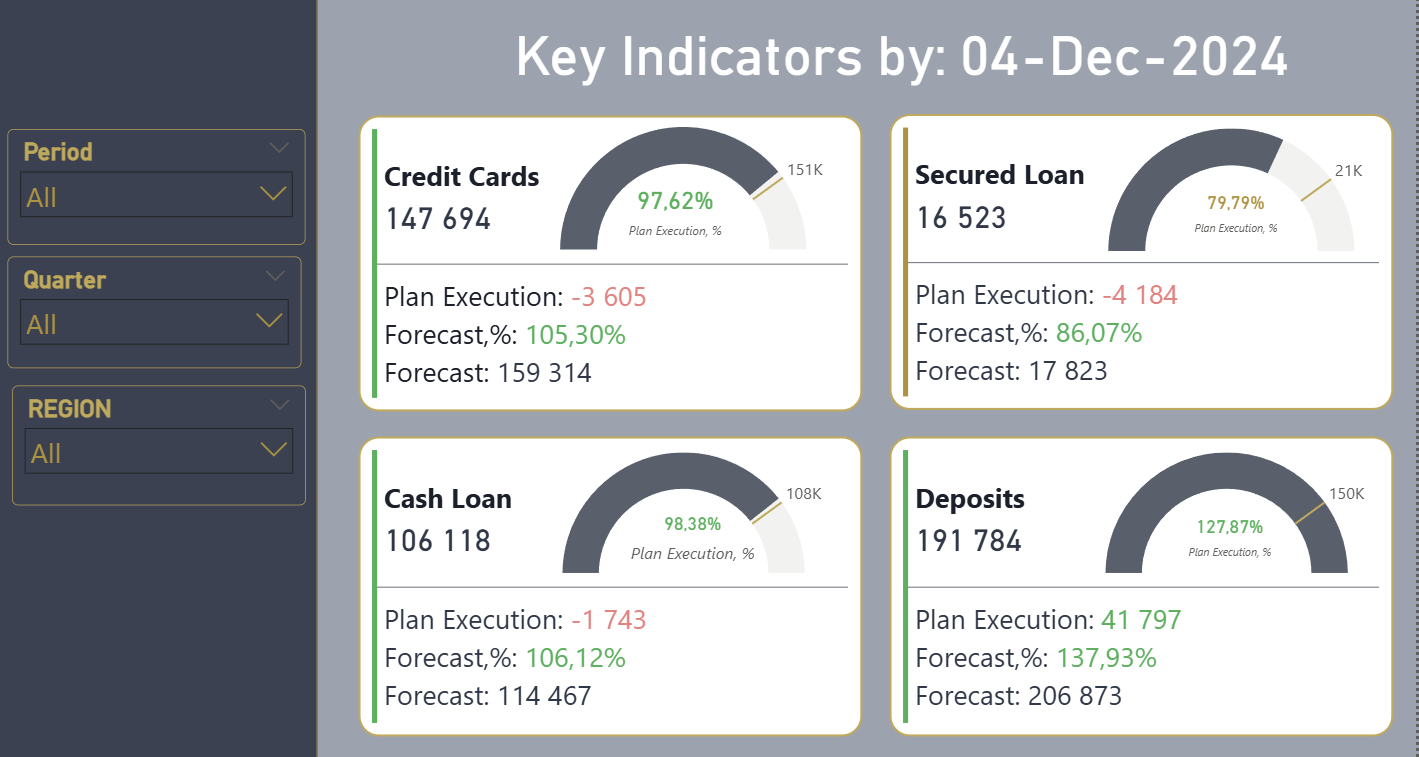
Target Performance
Sales analysis dashboard covering all 17 regions and key cities of Kazakhstan. Tracks daily and monthly dynamics for Sales, Revenue, ARPU, and Sales-to-Active %, with cohort survival tables (1m → 12m) and CY vs PY comparison across all metrics.
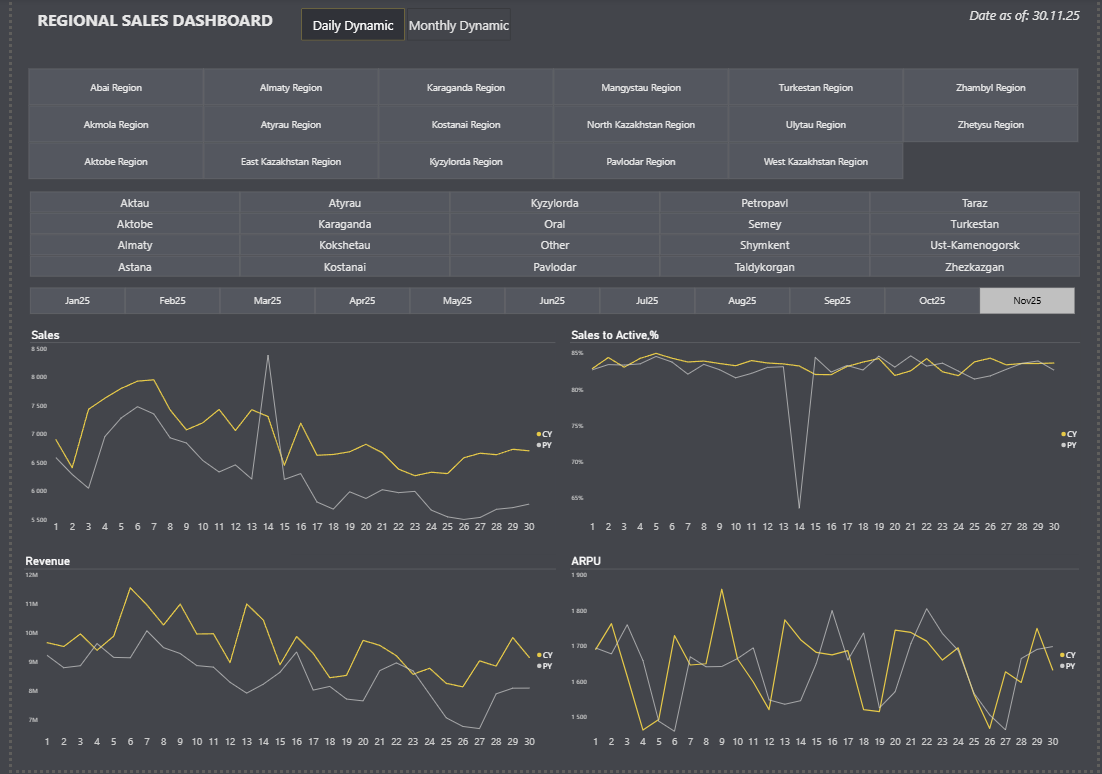
Daily Dynamic
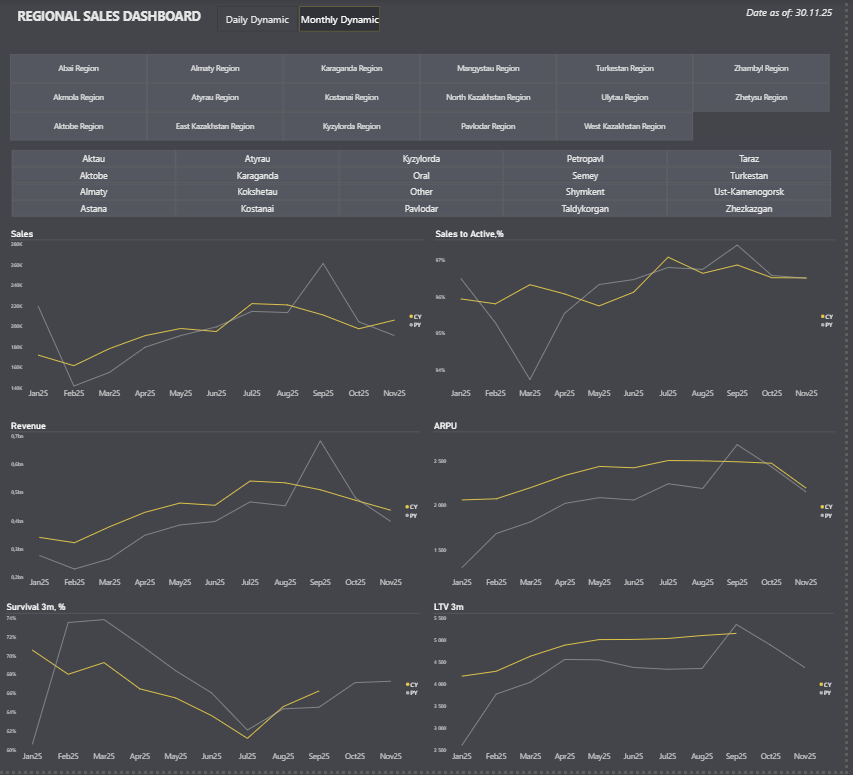
Monthly Dynamic
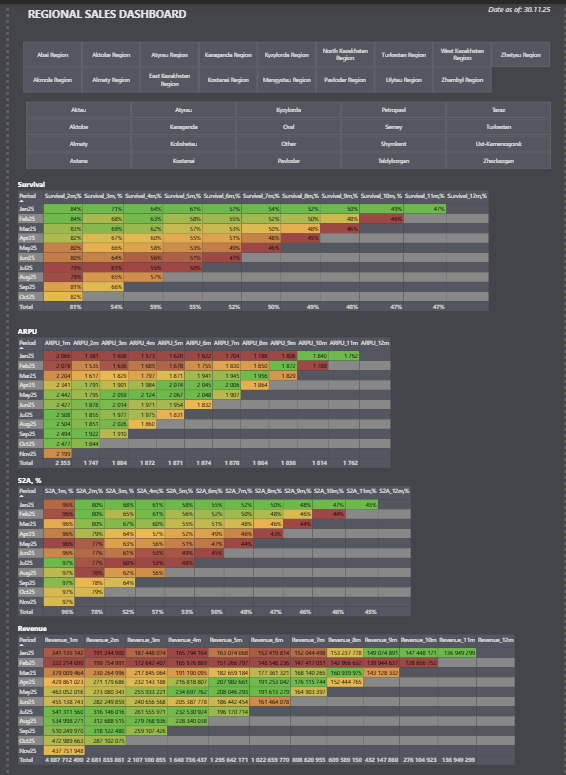
Sales and Survival — Cohort Tables
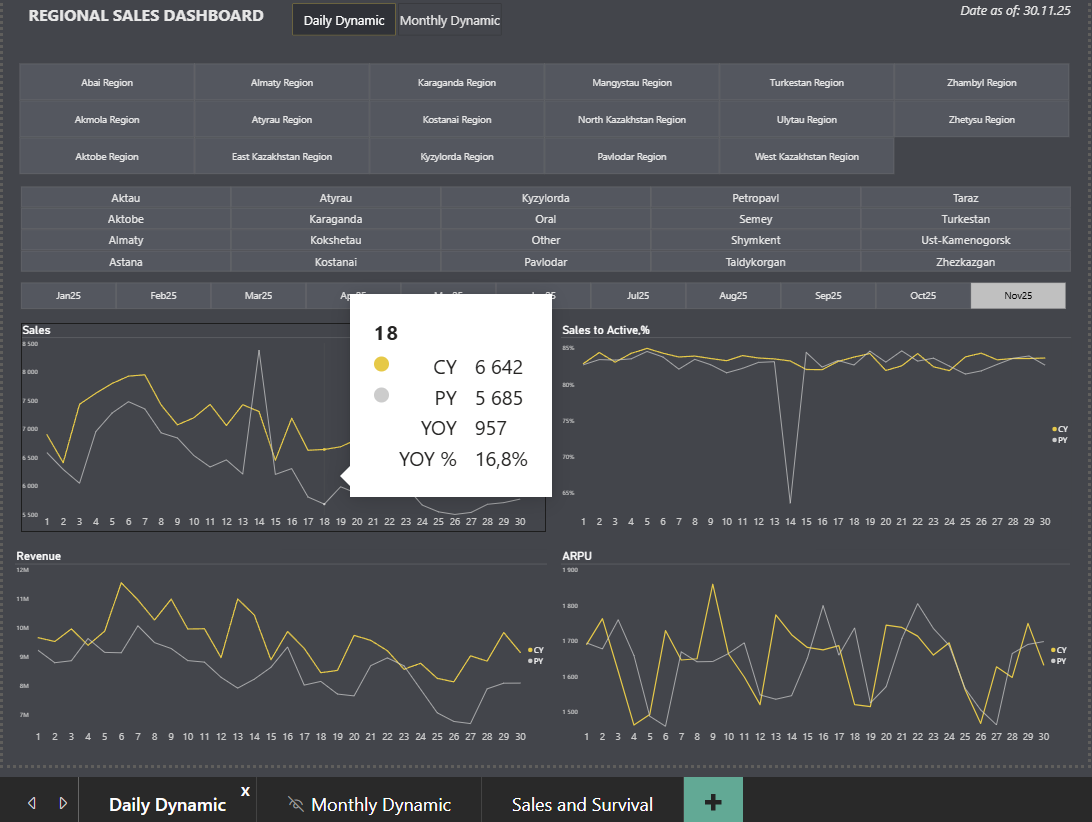
Tooltip — CY / PY / YOY / YOY %